Benchmarking Broadband Affordability
Broadband affordability is becoming a central policy issue across the United States. As states consider tools such as low-cost plan requirements and rate regulation, Virginia examined whether existing broadband plans are actually affordable for low-income households and what legislative action might be needed to close the gap.
Why affordability matters
In Virginia, the Joint Commission on Technology and Science (JCOTS) asked whether the Commonwealth should take a more active role in ensuring broadband affordability. This raised two practical questions:
- What is a defensible benchmark for an affordable low-cost broadband plan?
- Do currently available market plans meet that benchmark in practice?
To answer these questions, we used BQT+ to collect address-level broadband plan data across Virginia and evaluate affordability at the street-address granularity.
Data and methodology
We studied ten representative Virginia localities, chosen to reflect geographic, socioeconomic, and infrastructural diversity:
- Counties: Pittsylvania, Halifax, Rockbridge, Loudoun, Fauquier, and Albemarle
- Cities: Portsmouth, Martinsville, Harrisonburg, and Richmond
Using census block groups (CBGs) as the unit of analysis, we sampled at least 30 residential addresses per CBG–ISP pair and queried each address with BQT+. The resulting dataset covers 900 CBGs, 62,000 addresses, and 10 providers (fixed wired and fixed wireless). These include wired providers such as Xfinity, Verizon, Cox, Riverstreet Networks, Ting, and Lumos, as well as fixed wireless access (FWA) providers such as AT&T, Verizon, Riverstreet, and All Points Broadband.
For each CBG–ISP pair, we identified the low-cost plan meeting the FCC’s 100 Mbps minimum download threshold.
Defining an affordability benchmark
We define broadband affordability using a 2% income threshold applied to the 20th percentile of disposable household income, following the FCC’s affordability framework. Using 2023 American Community Survey data, we computed a local affordability threshold for each CBG in Virginia.
This analysis shows that a $30/month broadband plan would be affordable for approximately 93% of Virginia’s population, while higher price points quickly leave many households behind. For example, at $50/month, roughly half of households would face unaffordable options.
For that reason, we identify $30/month as a defensible statewide benchmark for a low-cost broadband plan.
Current Market State
Our analysis finds a substantial gap between this affordability benchmark and the plans available in the market.
- Only 0.45% of CBGs have access to broadband plans priced at or below $30/month
- About 41.2% of CBGs do not have access to any plan that meets their local affordability threshold
- Xfinity offers the lowest-priced qualifying plan in about 80% of studied CBGs, but those plans typically begin at $50/month
In other words, even though a $30 benchmark would make broadband affordable for most Virginians, the market rarely delivers plans at that price.
Affordability frontier
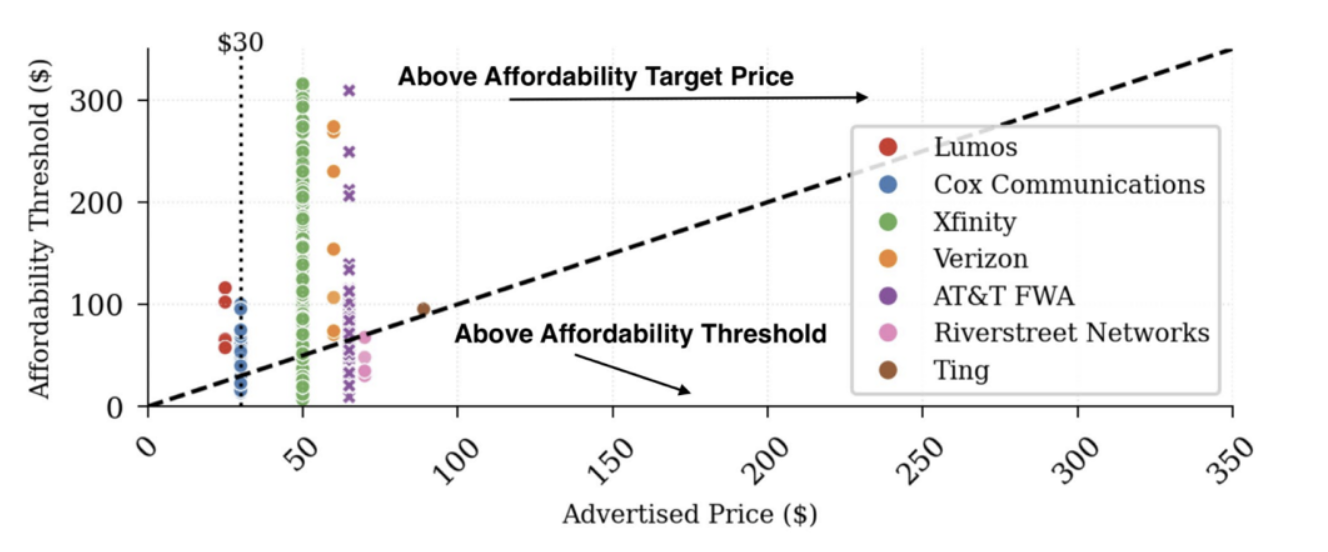
The figure above illustrates the current state of broadband availability, affordability, and quality using an affordability frontier.
- Each point represents a census block group (CBG), where a dot represents a CBG where the low-cost plan is less than 100 Mbps download, and a cross represents a CBG where the low-cost is greater than 100 Mbps download
- The x-axis shows the advertised price of the low-cost qualifying plan
- The y-axis shows the affordability threshold for that CBG
- The vertical dashed line marks the $30 benchmark
- The diagonal line marks the affordability frontier
Data points to the right of the affordability frontier indicate CBGs where the low-cost plan is unaffordable, while points to the left of the affordability frontier indicate CBGs where the low-cost plan remains affordable.
Additional findings
Our data also reveals several structural barriers beyond price alone.
Low-cost plans are often hard to find
Even when low-cost plans exist, they may be buried on ISP websites or require contacting customer service. This creates added friction for low-income households and for users with limited digital literacy.
Plan visibility changes over time
ISP websites are very dynamic. During our study, for example, Xfinity initially did not clearly surface low-cost plans, but later changed its interface to make them more visible. This highlights the need for ongoing monitoring rather than a single, one-time measurement.
Competition does not reliably lower low-cost prices
More providers in a market do not necessarily mean better affordability. In our data, increased provider competition did not consistently produce lower prices for entry-level qualifying plans.
Fixed wireless does not close the affordability gap
Contrary to common expectations, fixed wireless access was usually not the lower-cost option. In about 90% of CBGs where both wired and fixed wireless plans were available, fixed wireless plans were $10 to $60 more expensive while also offering lower average speeds.
Policy implications
Based on this analysis, JCOTS proposed three legislative actions to Virginia’s general assembly:
- Require ISPs to offer a 100 Mbps plan for $30/month statewide
- Require low-cost plans to be clearly visible and easily accessible on ISP websites
- Support targeted bridge programs for households that remain unserved by available market plans
JCOTS also emphasized the importance of independent, ongoing data collection using tools such as BQT+ so that policymakers can track changing broadband markets and evolving ISP interfaces over time.
Why this matters
This case study shows how robust, extensible data systems can support public decision-making. By converting complex and inconsistent ISP websites into structured evidence, BQT+ helps policymakers move from data to action.
A complete discussion of the analysis and policy recommendations is available at this link.